


Can we trust the findings in the PISA 2018 report?
What are the headlines about reading and behaviour and can we trust the data? I’ve taken a look at the PISA 2018 report and offer a summary for the classroom teacher.
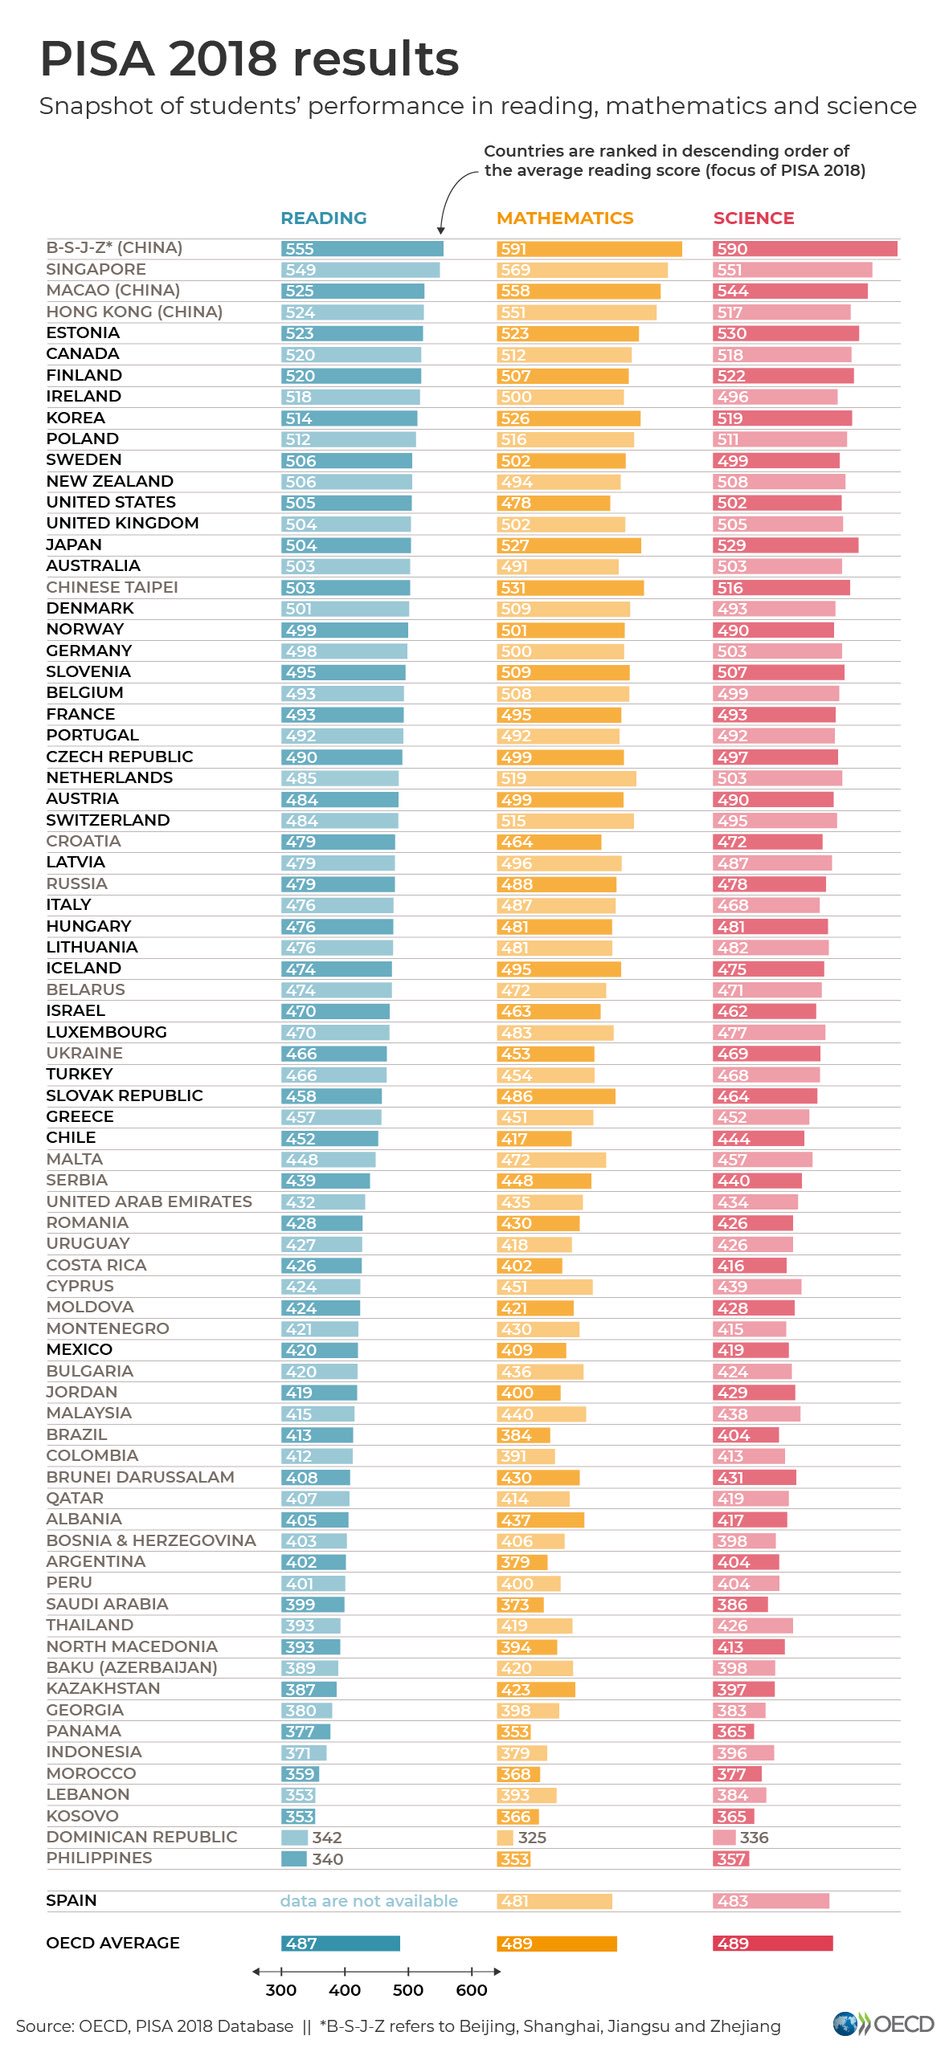
Initial thoughts…
Published by the OECD on 3rd December 2019, the PISA 2018 report includes 79 countries. Of these, 37 were members of the OECD members. In England, 5,174 15-year-old pupils in 170 schools completed a 2-hour computer-based assessment and pupil questionnaire. The test was conducted between October 2018 to January 2019 and pupils receive no feedback/grade = potential to have less effort. In England, the majority of pupils were in Year 11; each school selects 40 pupils who met the PISA age definition. The final school response rate for the UK was 87 per cent – 170 schools in England (NI 75, Wales 107, Scotland 107). When I first looked through the official OECD report, these were my initial thoughts as I glanced over the data:
- It’s frightening to see the number of countries increasing by name on this PISA list. It’s only a matter of time before every education system around the world is ranked by OECD. Is it time to pull the GERM plug?
- OECD now has growth mindset measured in PISA rankings. I’m sure Carol Dweck didn’t want this? The question asked of pupils was: “Your intelligence is something about you that you can’t change very much.”
- Who knew? Many 15-year olds want to be a teacher! Girls, more than boys…
- Countries and economies are ranked in descending order of the percentage-point difference between students who are academically resilient and those who are not. This should concern all of us! Just take a look at where the United Kingdom, Finland and Estonia are on this table!
- Finally, the term ‘error’ does not imply a mistake has been made; it highlights necessary uncertainty.
Achievement of 15- year-olds in England
It’s been almost one year since the data was collected and there are 246 pages in the Department for Education’s report. I’ve grabbed a number of images below and included what I believe are the most important factors for teachers to know. Obviously, go beyond my interpretation and skim over the full report to gain a comprehensive summary.
- Performance: Mean scores in England were significantly above the OECD averages in all 3 subjects.
- Reading: England’s mean score for reading was similar to scores for Scotland and Northern Ireland, and all 3 had scores significantly higher than Wales. The mean reading score in England has remained consistent since 2006, and is above the OECD average. However, the scores among the lower achievers have remained stable over time and in common with all other participating countries, girls in England (and in all other OECD countries) outperformed boys in reading. The gender gap is smaller in England than the average gap across OECD. Finally, pupils in all countries of the UK had more negative attitudes towards reading than the OECD average.
- Maths: Lower achieving pupils made greater improvement in mathematics than higher achievers and England’s mean score in mathematics is significantly higher than in PISA 2015.
- Growth mindset: Pupils in England were, on average, less satisfied with their lives than pupils across the OECD.
- Selection: There were larger differences in reading achievement between pupils attending the same schools than there were between pupils in different schools. This is to be expected in a comprehensive education system, compared with selective systems that show a larger difference in achievement between schools. Only 500 FSM pupils took part compared to 4,243 non-FSM pupils. The EAL/ethnicity balance is skewed…
- Behaviour: Headteachers in England reported fewer discipline problems or problems with either teacher or pupil behaviour than the OECD average. This seems to pair up with EEF research (June, 2019).
- Participation: Finally, one-in-four schools in the UK (27%) refused to take part (FFT Datalab) which makes the UK response lower than OECD requirements. No details on the bias analysis have been published by the Department for Education or by OECD. One in six pupils in England who were due to sit the PISA test, were either absent or refused. Only Portugal had a worse pupil response rate which, as FFT Datalab write… “calls into question the quality of the data.”
- Interpretation: A normal distribution has a mean of 500 and standard deviation of 100. There is also an ‘effort thermometer’ for pupils to indicate how much effort they had invested in the PISA test. See age 246 for details: The UK score was 76.01 per cent. The OECD average was 68.42. Estonia scored 67.97 and Finland 69.68. Our pupils put more effort into the test…


One in six pupils in England who were due to sit the PISA test, were either absent or refused. The DfE have not reported how the ‘bias analysis’ was completed.
You can download the official PISA document and the DfE’s report on England, Wales, Northern Ireland and Scotland.


English students had a more negative attitude to reading than in other countries. Those sitting the test are 15/16. They will have learned to read under the Searchlight method, which essentially used whole word with a bit of analytic phonics and the four cueing system (which includes using pictures to work out what a word is), accompanied by the ‘reading for a purpose, not for pleasure’ philosophy. I have had to teach the Searchlight system as a supply teacher and wondered how on earth children were meant to learn to read just from looking at the words (osmosis and memorization apparently)! Thus, it looks as if this system, which makes reading very hard (a psycholinguistic guessing game) is liable to give the students a negative view of reading. It will be interesting to see the attitude to reading found in ten years time from cohorts who have been taught using SSP.
Why would the Growth mindset of Pupils in England be, on average, less satisfied with their lives than pupils across the OECD?
If you look into the study what is REALLY big headlines are that the life satisfaction of 15-year-olds across the UK has fallen faster than in any other country with comparable data over the last three years. Students in the UK were also much less likely to report that they have a sense of meaning in life than their peers in other OECD countries.
Governments, schools, parents, carers, teenagers all need to ACT because having purpose is what makes achievers.
It’s a good question which I’ve highlighted on Twitter…